The Real Cost of Technical Debt: A CFO's Guide
Rashad Cureton
Founder, Cure Consulting Group
Why Your CFO Should Care About Technical Debt
Every quarter, your engineering team asks for "refactoring time" — sprints dedicated to fixing things instead of building new features. And every quarter, your CFO asks the same question: "What's the business justification?"
It's a fair question. And most engineering leaders do a terrible job answering it.
Technical debt is a financial concept borrowed by engineers, but ironically, engineers rarely translate it back into financial terms. Let me bridge that gap.
Technical Debt, Explained Without Code
Think of technical debt like deferred maintenance on a building. When you build quickly, you make trade-offs: you skip the proper foundation in one area, use cheaper materials in another, leave wiring exposed instead of running it through conduit.
The building works. Tenants move in. Revenue flows. But over time:
- The HVAC system runs inefficiently because it wasn't sized for the current occupancy
- Plumbing fixes take twice as long because the pipes are routed illogically
- You can't add a new floor because the foundation wasn't designed for it
- Insurance costs rise because the exposed wiring fails code inspections
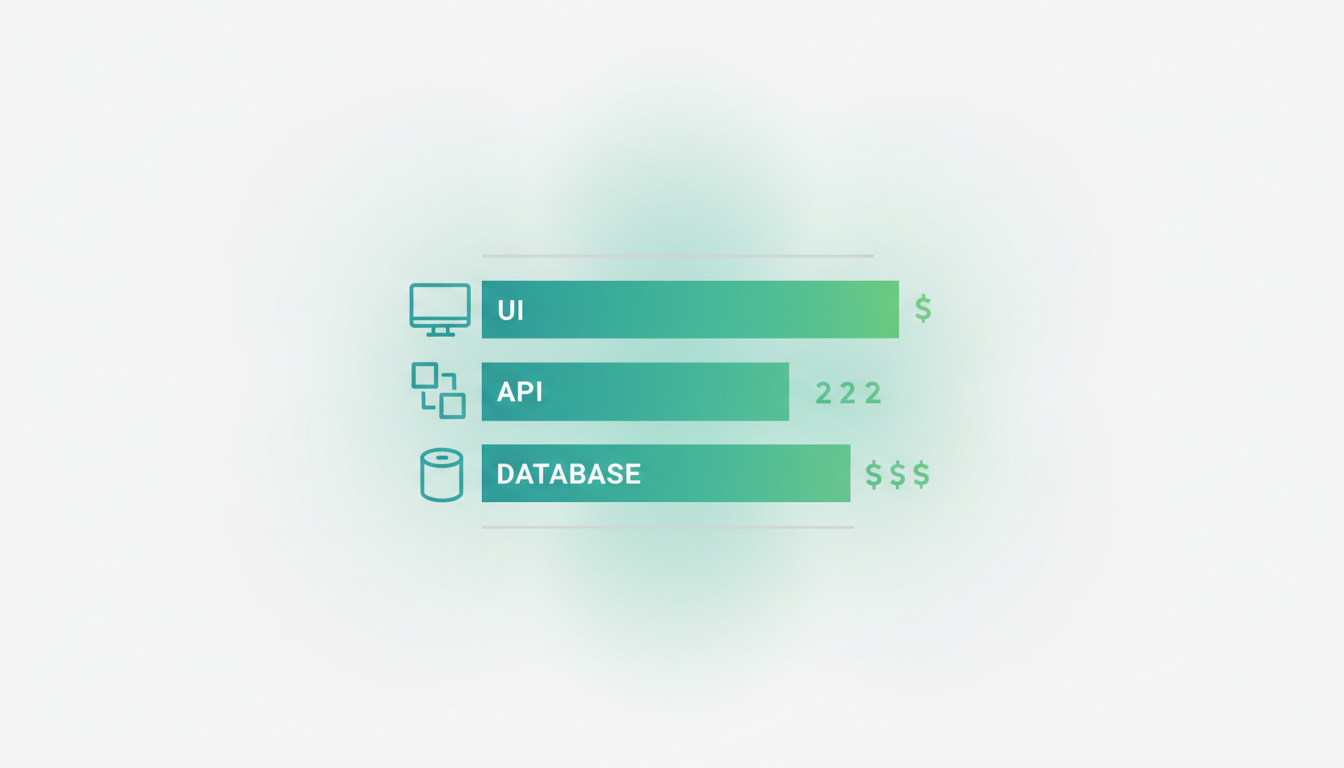
In software, the equivalent looks like:
- Slower feature delivery: What should take a week takes three because engineers navigate around fragile code
- More bugs: Each new feature introduces regressions in seemingly unrelated areas
- Higher hosting costs: Inefficient code and database queries consume more infrastructure
- Hiring difficulty: Good engineers don't want to work in poorly maintained codebases
Quantifying Technical Debt in Dollars
Here's the framework I use with clients to translate technical debt into language a CFO understands:
1. The Velocity Tax
Measure how long features take now versus how long they took 12 months ago. If a comparable feature took 2 weeks a year ago and takes 4 weeks now, you're paying a 100% velocity tax.
Formula:
Annual velocity cost = (current avg feature time - baseline feature time)
                       x number of features per year
                       x engineering hourly cost
Real example: A SaaS client's feature delivery had slowed from 2 weeks to 5 weeks average. With 24 features per year and $150/hour engineering cost (fully loaded), the velocity tax was:
3 weeks x 40 hours x 24 features x $150 = $432,000/year in lost velocity.
2. The Bug Tax
Track the percentage of engineering time spent on bug fixes versus new features. Healthy teams spend 10-15% on bugs. Debt-heavy teams spend 30-50%.
Formula:
Annual bug cost = (actual bug % - healthy bug %)
                   x total engineering hours
                   x hourly cost
If your 8-person team (12,800 hours/year) spends 40% on bugs instead of a healthy 15%, at $150/hour:
25% x 12,800 hours x $150 = $480,000/year in excess bug-fixing.
3. The Infrastructure Tax
Compare your cloud costs per user to industry benchmarks. SaaS platforms should cost $0.50-$2.00 per user per month in infrastructure. If you're at $5.00+, your code is probably inefficient.
4. The Opportunity Cost
This is the hardest to quantify but often the largest. Features you can't build because the architecture won't support them. Markets you can't enter because your platform can't scale to new regions. Partnerships you can't close because you can't pass a security audit.
At JP Morgan, I watched a $2M partnership opportunity evaporate because the partner's technical due diligence revealed architectural issues that would take 6 months to resolve. The debt wasn't just expensive — it was a revenue blocker.
Get insights like this in your inbox
Practical tips on AI, mobile & cloud — no spam.
The Debt Quadrant: Not All Debt Is Equal
I categorize technical debt into four quadrants that help prioritize what to address:
| Low Impact on Revenue | High Impact on Revenue | |
|---|---|---|
| Easy to Fix | Pay down opportunistically | Fix immediately |
| Hard to Fix | Monitor but don't prioritize | Plan a dedicated initiative |
Examples:
Easy fix, high revenue impact: Adding database indexes to speed up the customer-facing dashboard. 2 days of work, 10x performance improvement, directly reduces churn.
Hard fix, high revenue impact: Migrating from a monolithic API to service-oriented architecture to support multi-tenant enterprise sales. 3-6 month effort, but it unlocks a new market segment.
Easy fix, low revenue impact: Upgrading a deprecated library. 1 day of work, reduces security risk, but no user-visible impact.
Hard fix, low revenue impact: Rewriting the admin dashboard. 2 months of work, only internal users affected. Defer this.
When to Pay Down Debt (A Decision Framework)
Pay now when:
- Debt is directly causing customer churn (performance, reliability, security)
- Debt is blocking a revenue-generating feature
- Debt is increasing cloud costs faster than revenue growth
- A security or compliance audit is approaching
- You're about to hire — new engineers will be 50% less productive in a debt-heavy codebase
Defer when:
- The system is stable and revenue is growing
- You're pre-product-market-fit (speed matters more than quality)
- The affected code is likely to be replaced anyway
- The cost of fixing exceeds the cost of living with it for the foreseeable future
The 20% Rule
My default recommendation: allocate 20% of engineering capacity to debt reduction permanently. Not as "refactoring sprints" that get canceled when a deadline approaches, but as a standing allocation that's non-negotiable.
This prevents debt from compounding while maintaining 80% forward velocity. At Cure Consulting, we build this into every Build and Platform engagement — 20% of each sprint is dedicated to code quality, testing, and architectural improvements.
Communicating Debt to the Board
When presenting technical debt to non-technical stakeholders, use this structure:
- The business impact (not the technical problem): "Feature delivery is 40% slower than 12 months ago, costing us approximately $400K in engineering productivity annually."
- The root cause (in business terms): "We made deliberate trade-offs to launch faster, and those trade-offs are now expensive."
- The proposal (with ROI): "A 6-week focused investment of $120K will reduce feature delivery time by 35% and prevent an estimated $200K in incident response costs over the next 12 months."
- The risk of inaction: "Without intervention, we project delivery times will increase by another 25% over the next 6 months, and we cannot pass the SOC 2 audit required for enterprise sales."
The Bottom Line
Technical debt is not an engineering indulgence. It's a quantifiable business liability that compounds over time. The organizations that manage it well treat it like any other financial obligation — they measure it, budget for it, and pay it down strategically.
The organizations that ignore it eventually face a choice between a costly rewrite and a declining product. I've seen both outcomes. The rewrite is always more expensive than proactive maintenance would have been.
Need help quantifying your technical debt? Book a free architecture assessment — we'll evaluate your codebase and give you a dollar figure for what debt is costing your business.
Written by
Rashad Cureton
Founder & Principal Engineer
Rashad is the founder of Cure Consulting Group. Previously an engineer at JP Morgan, Ford, Clear, NYT, Kickstarter, and Big Nerd Ranch. He builds full-stack web and mobile apps for startups and companies of every size.
Related Articles
What Does Custom Software Actually Cost? A Transparent Breakdown
Everyone wants to know 'how much does an app cost?' before the first call. Here's the honest answer, broken down by tier, with real numbers from our engagements.
10 min

How to Choose a Development Partner: The Decision Framework
Hiring the wrong dev shop costs more than money — it costs you months you can't get back. Here's the framework I use to evaluate agencies, and the red flags I've learned to spot early.
9 min

When to Hire a Consulting Firm vs. Build In-House
Both options have tradeoffs. Here's an honest framework from someone who's been on both sides — as a consultant and as an in-house engineer.
7 min